Keg Yield Math: Pours, Loss and Pour Cost by Glass Size
A half barrel holds 1,984 ounces and you will never sell all of them. Work out pours per keg by glass size, where the lost ounces go, cost per ounce, and the pour cost targets worth tracking.
Barrel, Gallon and Ounce Conversions for Every Keg Size
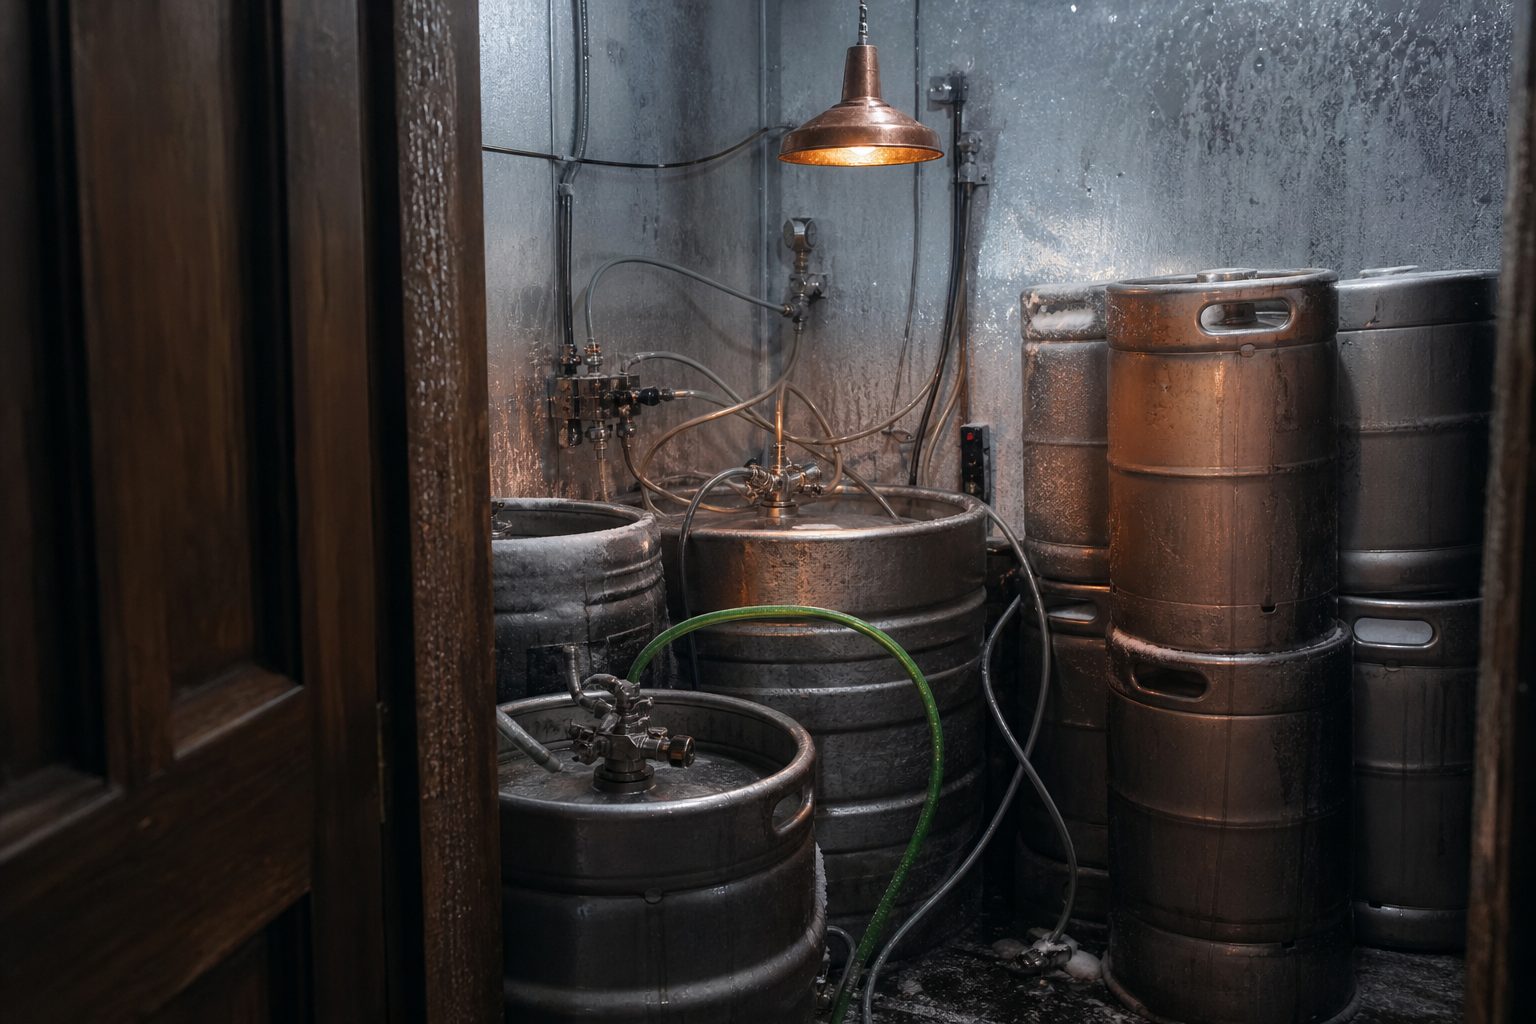
Every brewer and taproom manager knows the basic units, but it pays to have the math clear. The standard US half barrel keg holds 15.5 gallons. That is 1,984 ounces. A sixth barrel keg, also called a sixtel, holds 5.16 gallons, or 661 ounces. A quarter barrel pony keg holds 7.75 gallons, which comes to 992 ounces. These are the kegs you see most often in small breweries and taprooms.
Full barrel kegs are rare in craft beer service, but for reference, a full barrel is 31 gallons, or 3,968 ounces. Mini kegs, like the five-liter cans, are mostly a retail package. At the taproom, you are almost always dealing with half, quarter, or sixtel kegs. Knowing the weight of these numbers makes it easier to predict your pour counts, track shrinkage, and set pour sizes that work for your margin and your customer.
Keep reading: Release Day Behind the Bar: Keg Changes, Queues and Blowouts
Pours Per Keg at 16, 12 and 10 Ounces
Most taprooms serve beer in 16-ounce pint glasses, 12-ounce pours for higher-ABV or specialty beers, and sometimes 10-ounce glasses for strong or barrel-aged offerings. To estimate your gross number of pours from a keg, divide the total ounces by the glass size. For a half barrel:
- 16-ounce pours: 1,984 ounces divided by 16 equals 124 pours per keg.
- 12-ounce pours: 1,984 divided by 12 gives about 165 pours per keg.
- 10-ounce pours: 1,984 divided by 10 makes 198 pours per keg.
For sixtels (661 ounces):
- 16-ounce: 41 pours
- 12-ounce: 55 pours
- 10-ounce: 66 pours
But these are theoretical maximums. In practice, you will not get every drop out of the keg, and not every glass will be filled to the exact ounce. This is where the real-world numbers start to diverge from the calculator.
Where the Missing Ounces Go: Foam, Head Space and Line Pull
No taproom sells every single ounce from a keg. Several factors eat into your pourable volume. Foam loss is the first culprit. Each pour starts with a bit of foam, and some pints are poured off to get a proper head. The foam that settles in pitchers, glasses, and the drip tray adds up over the life of a keg.
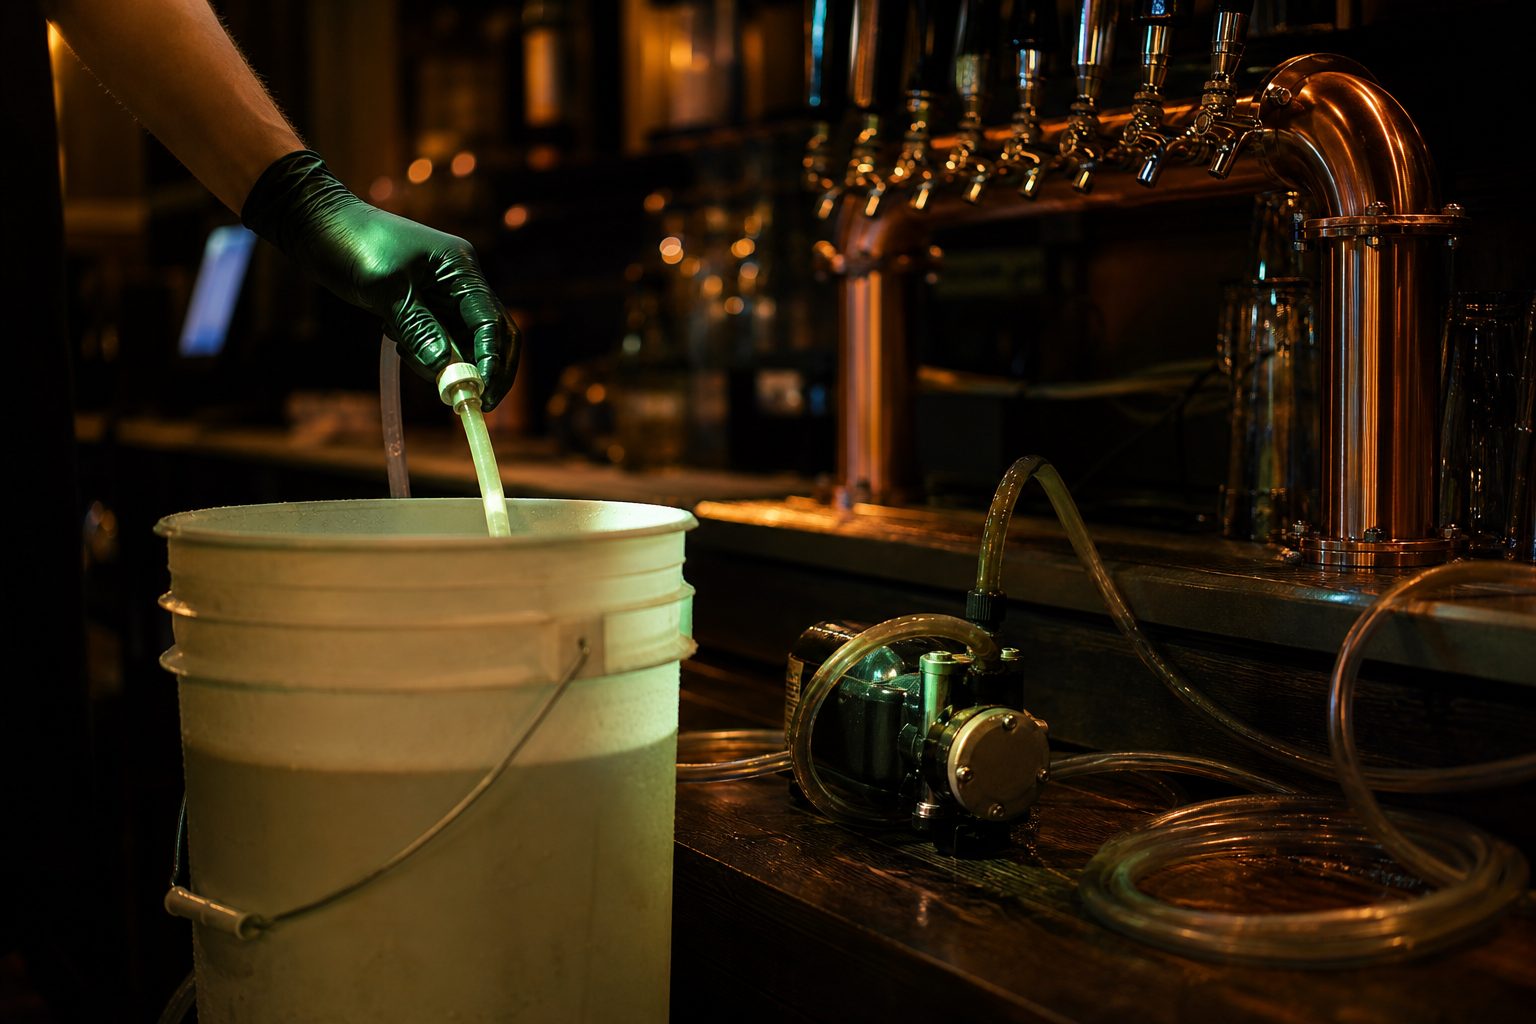
Next is the line pull. The beer lines between your keg and faucet contain beer that is lost every time you switch a keg or clean the lines. Longer runs, larger diameter lines, and frequent keg changes increase this waste. For most taproom setups, the line might hold anywhere from a few ounces to a pint or more per line.
Head space at the bottom of a keg also comes into play. The pickup tube does not always reach the very last ounce. Pressure drops, and a small layer of beer sits below the spear, especially if the keg is moved or jostled. Unavoidable waste also comes from staff training, accidental over-pours, or mis-poured samples.
In daily operations, it is common to see between 5 to 10 percent lost per keg. This means your 124 pours from a half barrel at 16 ounces will often be closer to 110 to 118 actual pints sold. Knowing this, you can adjust your sales projections, inventory, and ordering cycles with a more realistic number.
Keep reading: How to Run a Two Week Draft Line Cleaning Cycle in a Taproom
Cost Per Ounce From Malt Bill to Faucet
Understanding your cost per ounce is essential for setting prices that cover expenses and produce margin. Start with your malt bill, hops, yeast, adjuncts, and any specialty ingredients. Add labor, utilities, water, and packaging. Divide the total batch cost by the number of finished ounces packaged into kegs.
For example, if a 7-barrel batch (217 gallons) costs $600 in raw materials and yields 216 usable gallons after losses, that is 27.5 cents per gallon for raw ingredients. Divide that by 128 (ounces per gallon) to get about 0.21 cents per ounce in ingredients. But this is only the starting point.
Layer in other costs: labor to brew and clean, utilities for the brewhouse, cleaning chemicals, rent allocated by square footage, and overhead. Many breweries find that once all costs are included, the per-ounce figure can double or triple compared to the raw material cost alone. After that, add packaging costs if you sell in cans or bottles, but for taproom pours, this is usually just the cost of kegs and CO2.
Knowing your true per-ounce cost helps set accurate pour prices. If you sell a 16-ounce pint and your all-in cost is 20 cents per ounce, your cost for the glass is $3.20. To hit a typical pour cost target, your sale price will need to be at least twice this, often more.
Setting Pour Cost Targets by Style and Package
Pour cost is the percentage of your sale price that goes to the beer in the glass. Most taprooms track this closely, aiming for a pour cost range that ensures every beer pays its way. The right target depends on your market, beer style, and pricing strategy. Many operations aim for a pour cost between 18 to 24 percent for their core beers.
Specialty and barrel-aged beers often cost more to make and command higher prices per pour. For these, a pour cost up to 28 percent can be acceptable. Seasonal beers and experimental batches may run higher, especially if rare hops, fruit, or aging are involved. Always check your numbers before setting a price on these, as actual ingredient costs can be much higher per ounce.
Packages also matter. Beer poured in-house from a keg tends to have a lower pour cost percentage than packaged product, since you avoid canning or bottling costs. If you sell crowlers, growlers, or to-go kegs, factor in the container costs and any labor for filling.
Tracking pour cost by style and by package type lets you spot issues before they become margin killers. Consistently high pour costs can signal over-pouring, excessive waste, or a need to revisit your pricing model. Low pour costs may mean pricing is too aggressive, leaving money on the table.
See how TapListLive handles this for craft brewing
Reading Keg Depletion Against Register Counts
One of the simplest methods to check for loss is to compare the volume dispensed from a keg to what the register says was sold. At keg change, note the start and end level, and calculate the number of pours that should have been possible, based on your standard glass size. Then, pull the sales report for that item and see how many pours actually rang through.
If the register shows fewer pours than your keg math predicts, the difference is your missing ounces. Some loss is always expected, but a gap wider than 10 percent should trigger a closer look. Possible causes: staff pours for themselves or friends, excessive foam, or unrecorded samples. Tightening up procedures or switching to measured-pour faucets can close this gap.
Many taprooms use colored tape or labels to track which keg is on tap, making it easier to match sales to specific kegs. Others use digital tap list tools that track keg changes and pour history. The more closely you monitor depletion, the easier it is to spot trends and address issues before they cut too deeply into margin.
The Handful of Numbers Worth Checking Weekly Instead of Monthly
Most owners and managers review inventory, pour cost, and shrinkage once a month. For tighter control, these numbers should be checked at least weekly:
- Keg depletion by SKU: How many pints did you actually pour versus what you should have poured?
- Gross pour cost: Are your core beers hitting your target range, or drifting?
- Shrinkage percent by tap: Which beers are losing the most to waste?
- Register-to-pour discrepancy: How do register sales line up with keg depletion?
- Glassware loss and over-pours: Are you replacing more glassware, or seeing more waste, than expected?
Checking these numbers weekly gives you a much faster response time. You catch problems while they are still small, and you can adjust pricing, training, or procedures before the month is gone. Over time, this builds a culture of accountability and keeps your margins healthy.
Tracking keg depletion, pour counts, and sales in real time is easier with digital tap list management tools. When you can see pours per keg, ounces remaining, and sales by tap at a glance, on your taproom screens, your website, or a QR menu, it makes these weekly checks faster and more accurate.